View the real compiled Local Analytics 1.4.5 interface using synthetic demo data, with light and dark screenshots of Overview, Explorer, evidence and settings.
Tags: Screenshots
[download original] [view raw text] — 2,750 bytes
On this page
Local Analytics 1.4.5 — screenshot guide
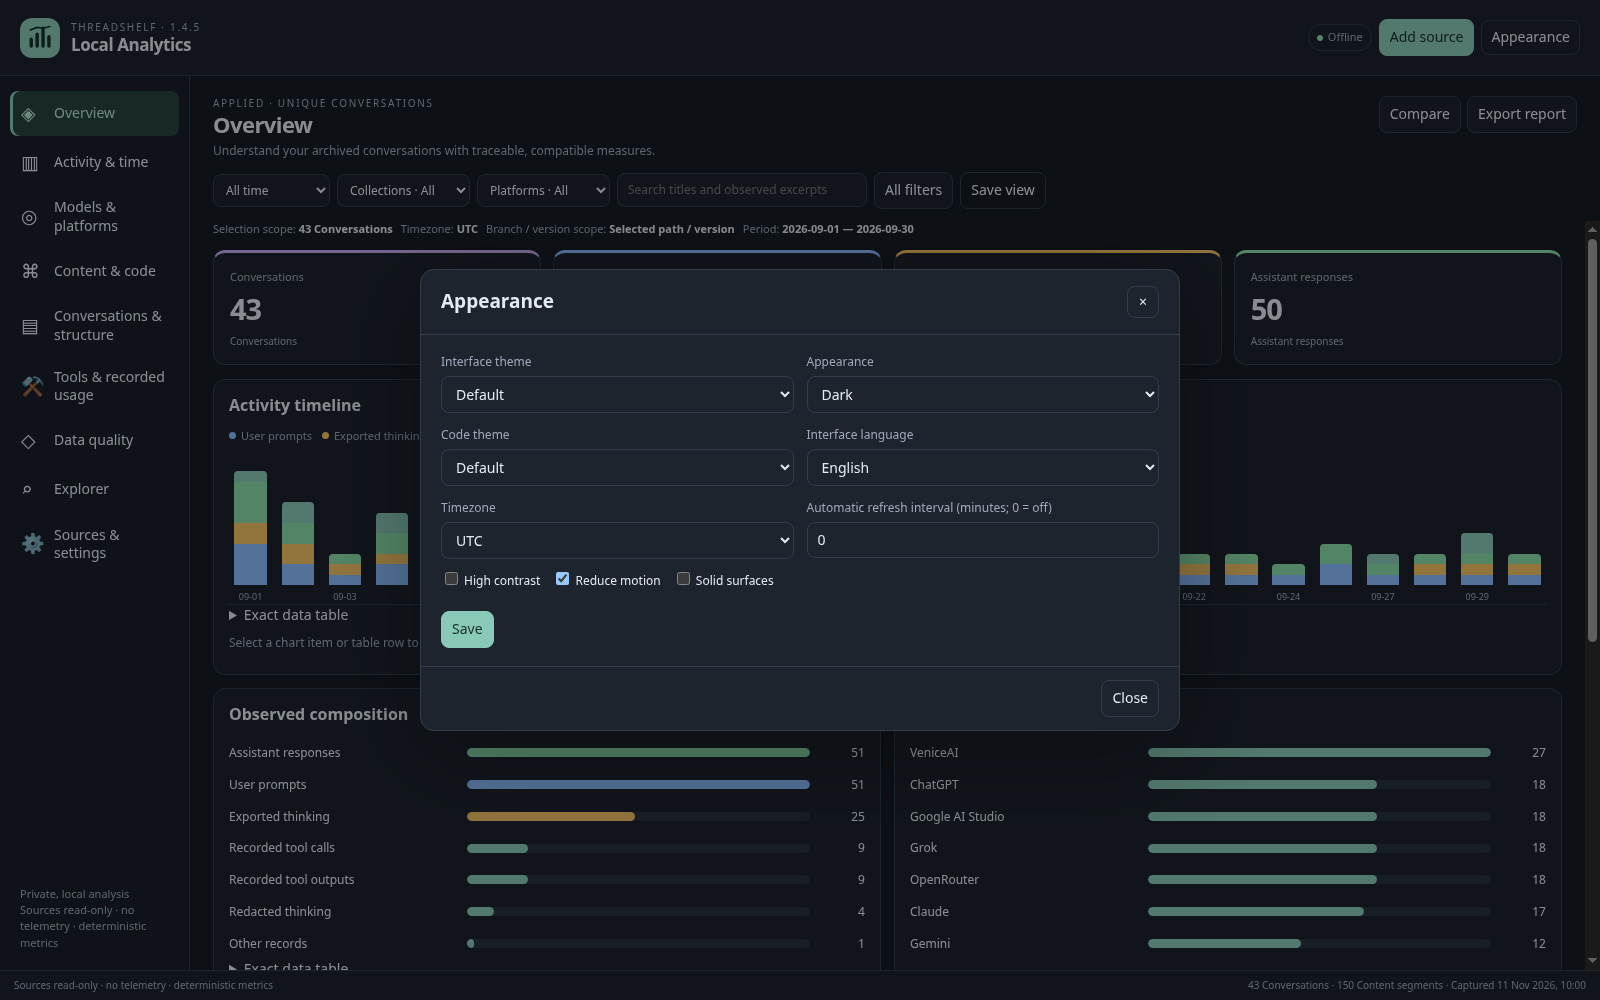
These screenshots show the public Local Analytics 1.4.5 native Linux interface using an Analytics-owned snapshot of the bundled 43-conversation synthetic fixture. The actual backend and analysis workers produce the displayed reports. Twelve images are 1600 × 1000; the compact example is 680 × 540, all at 100% zoom. Analytics has no Text-to-Speech settings.
Overview: scope before interpretation
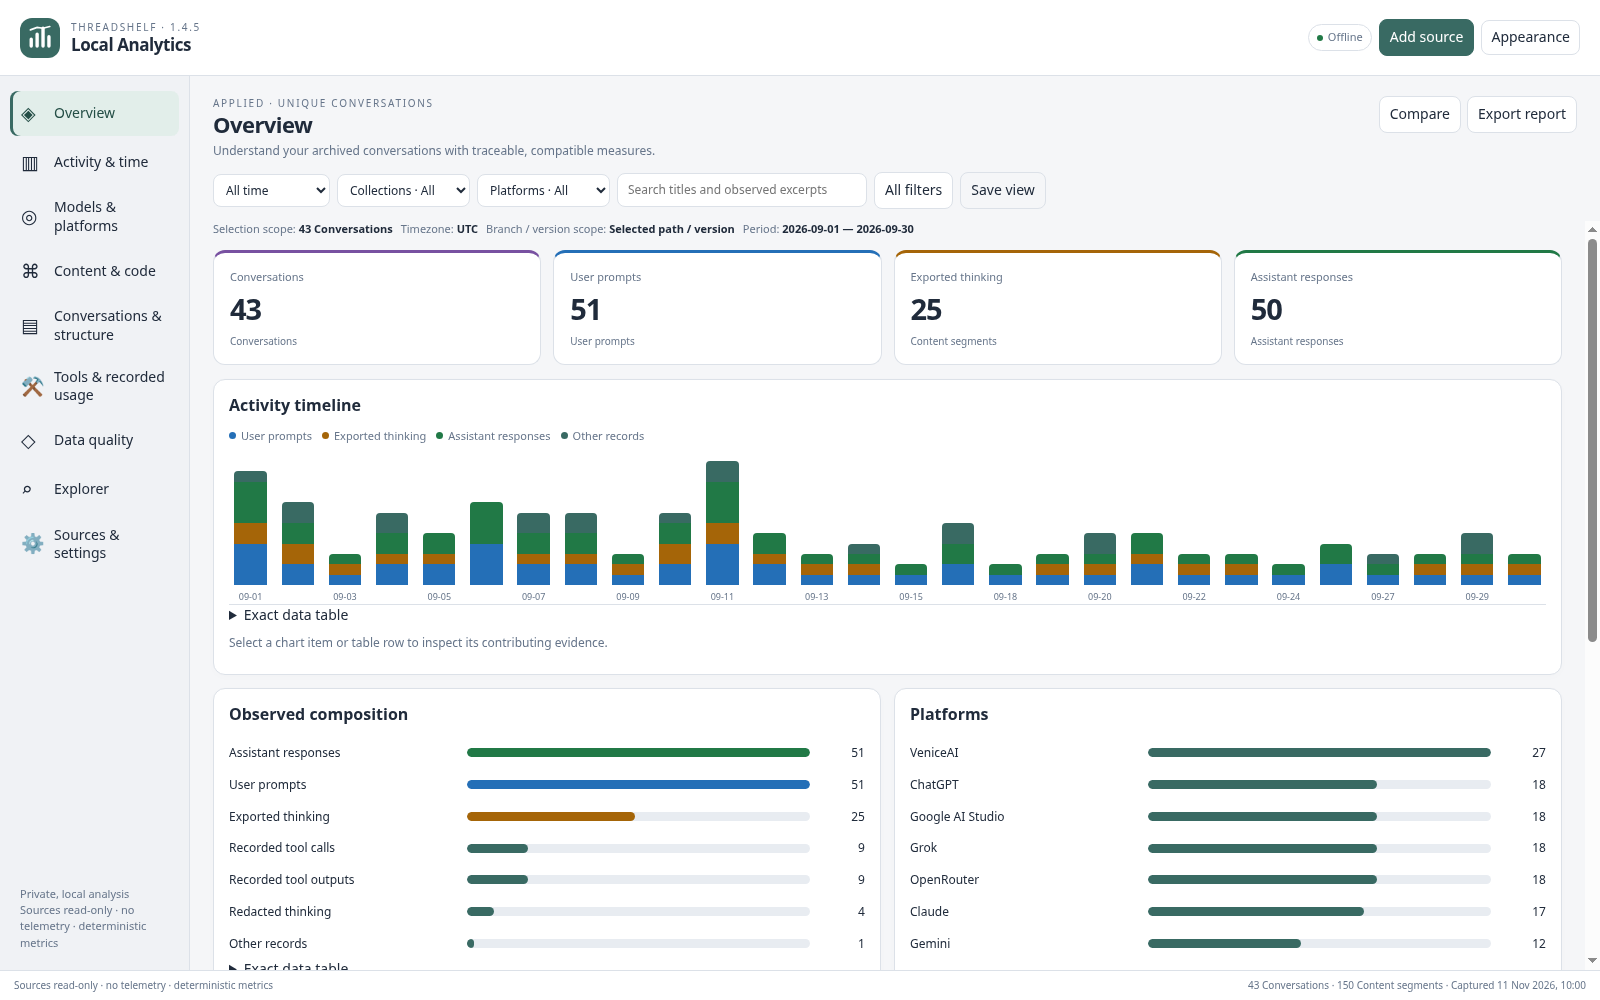
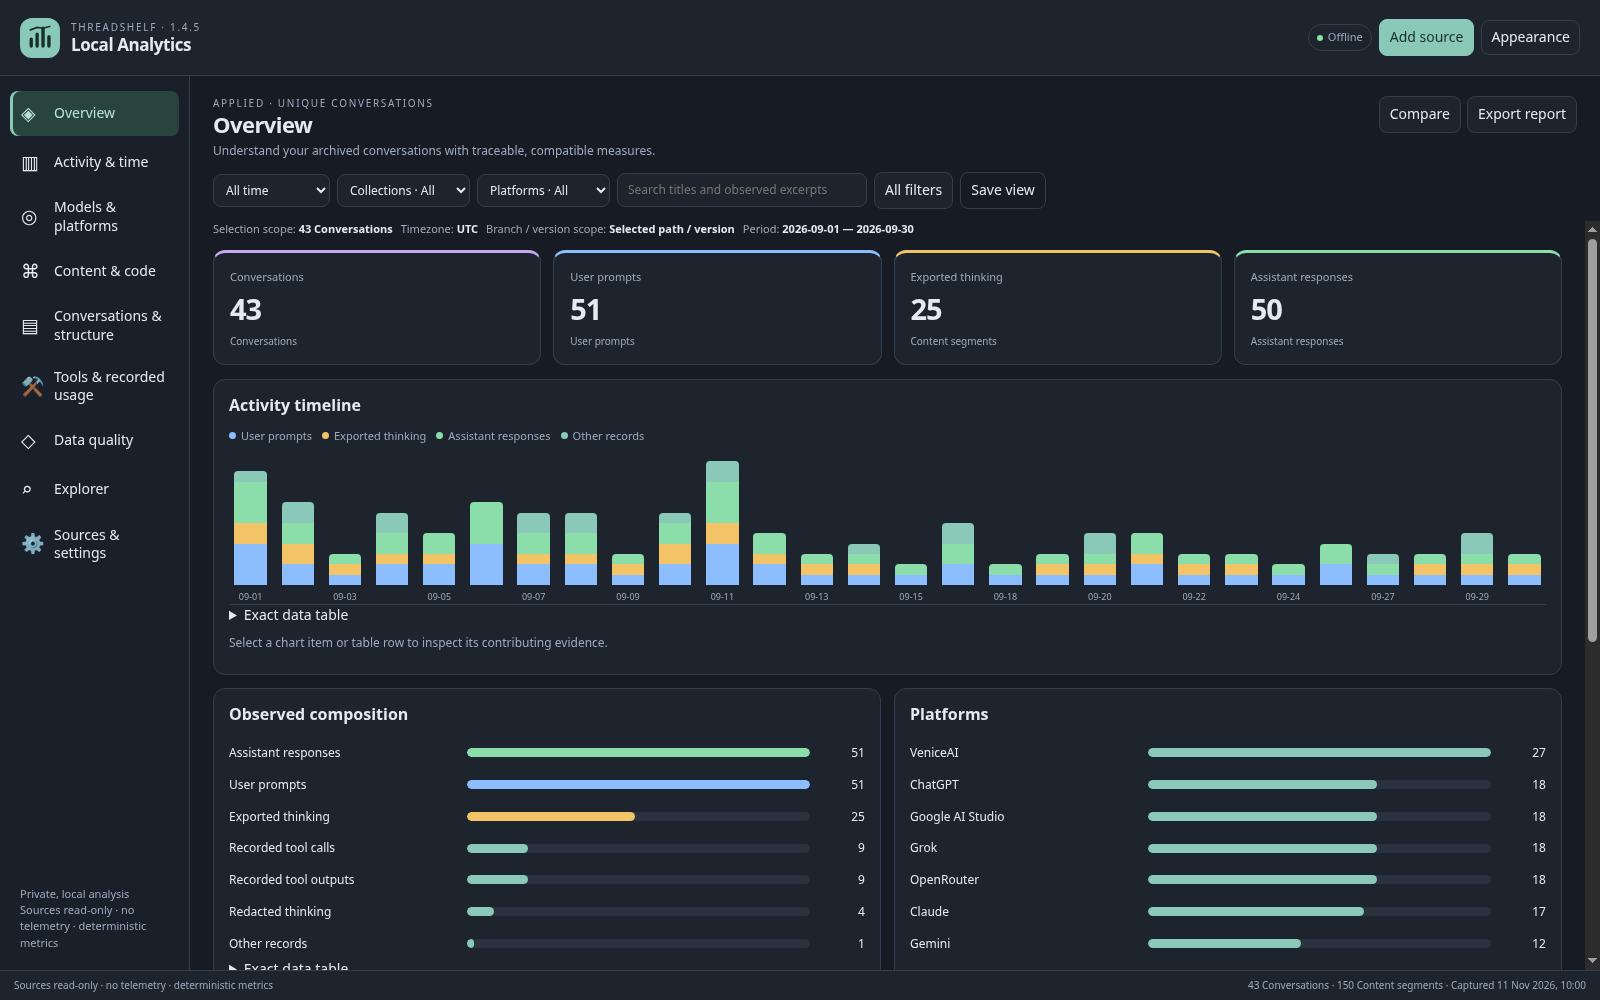
Overview summarizes the applied capture and selections. Review the scope summary before comparing a card or chart. Light and dark use the same sample population.
Explorer: distributions and sequences
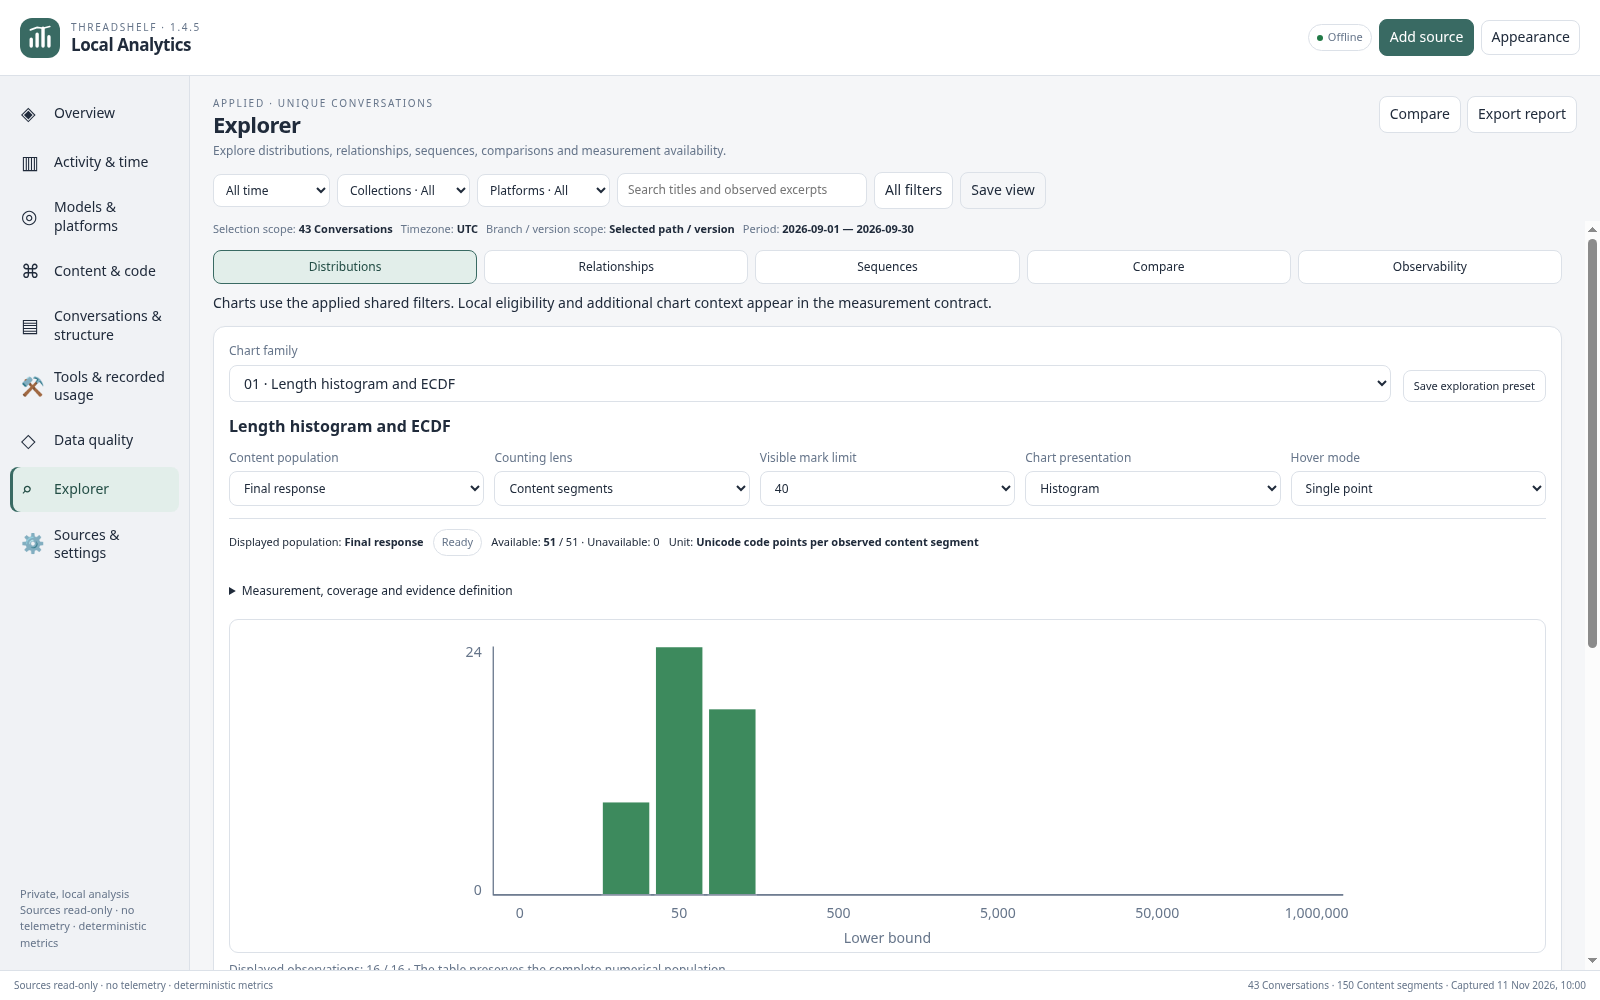
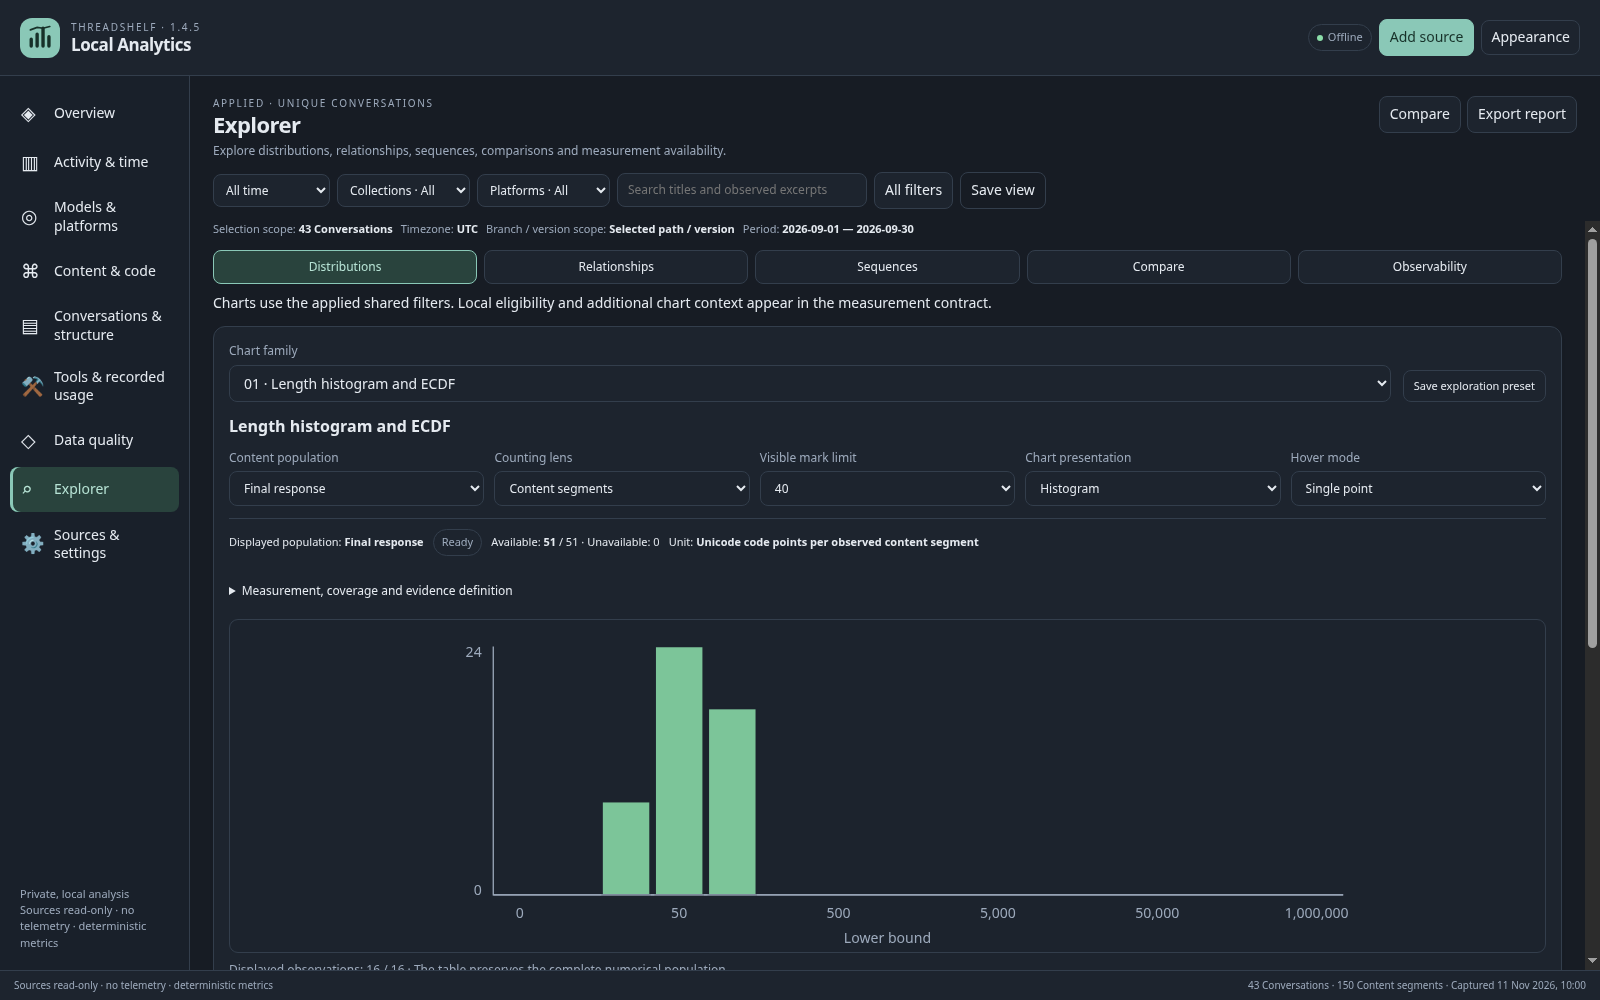
Explorer families describe particular populations and denominators. The distributions guide and sequence guide explain eligibility, buckets and boundaries.
Relationships: inspect contributors
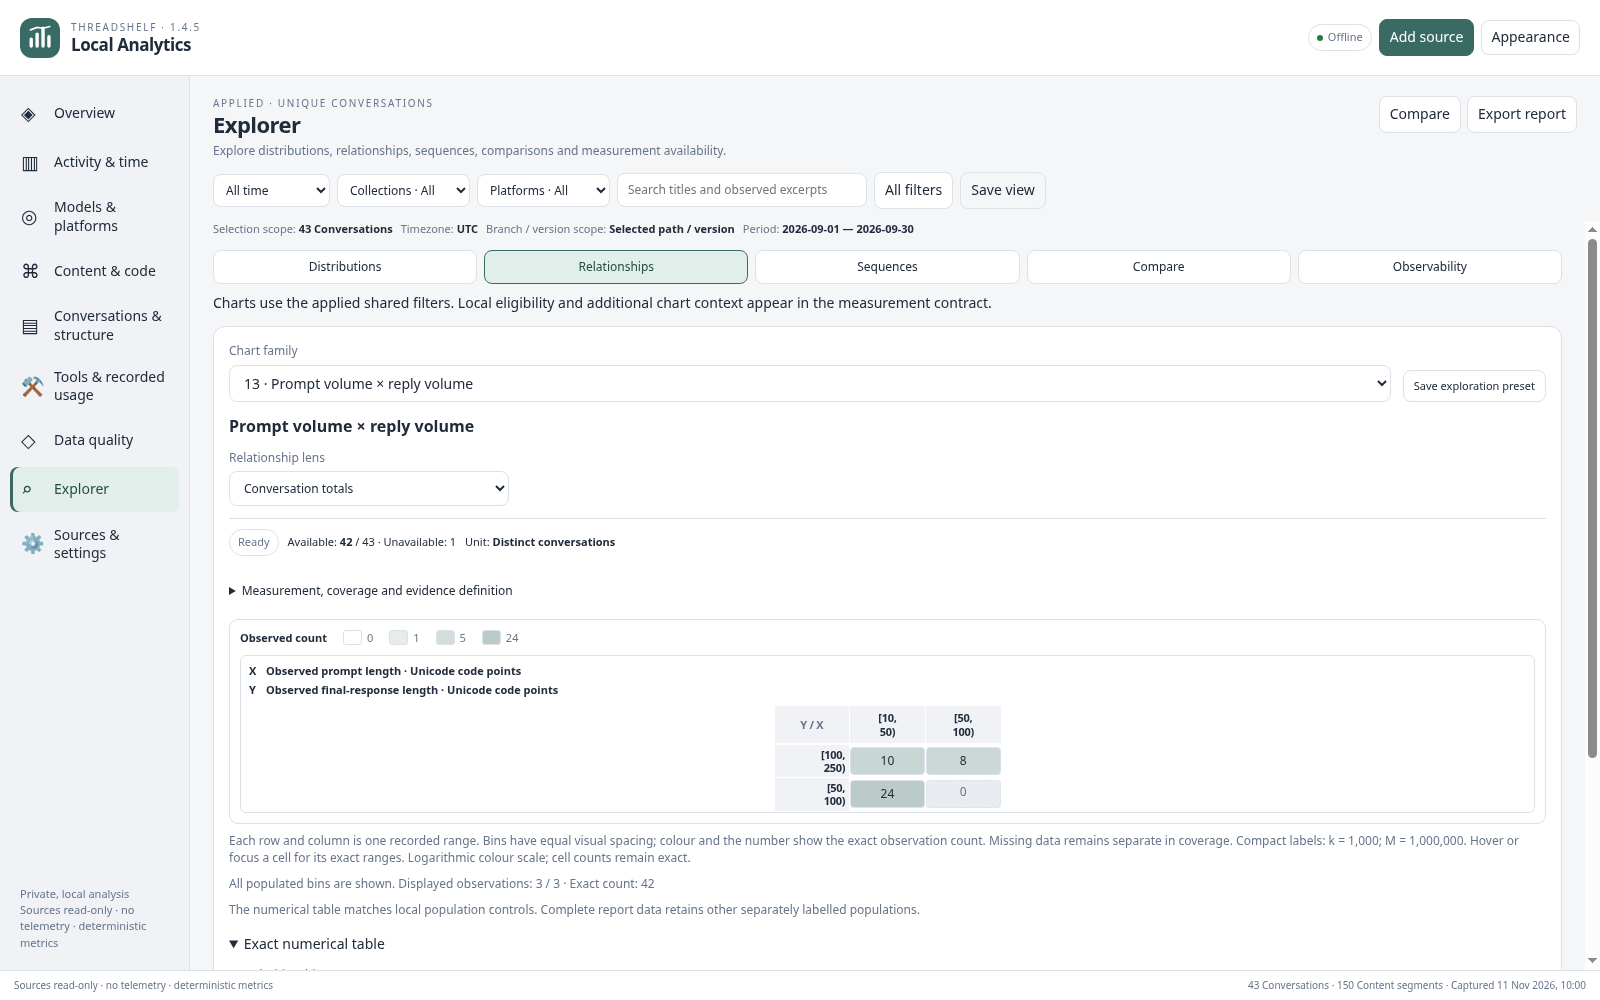
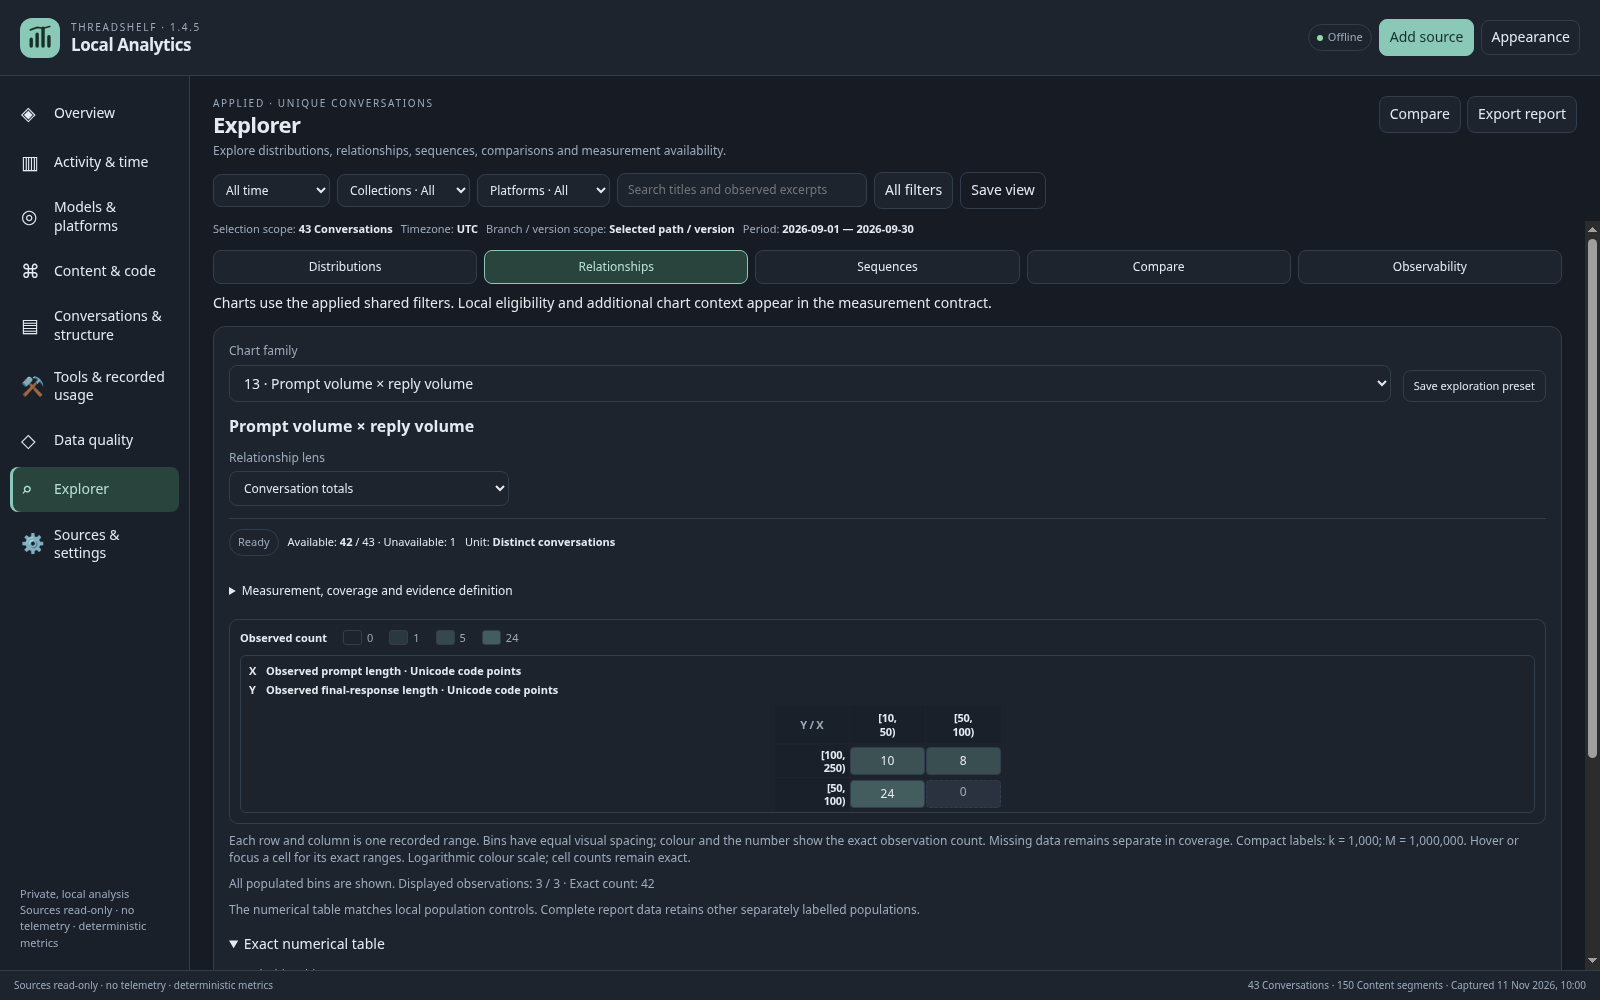
Pairwise displays connect dimensions within the selected population. Use evidence to inspect the records behind a cell; a visual association is not proof of causation.
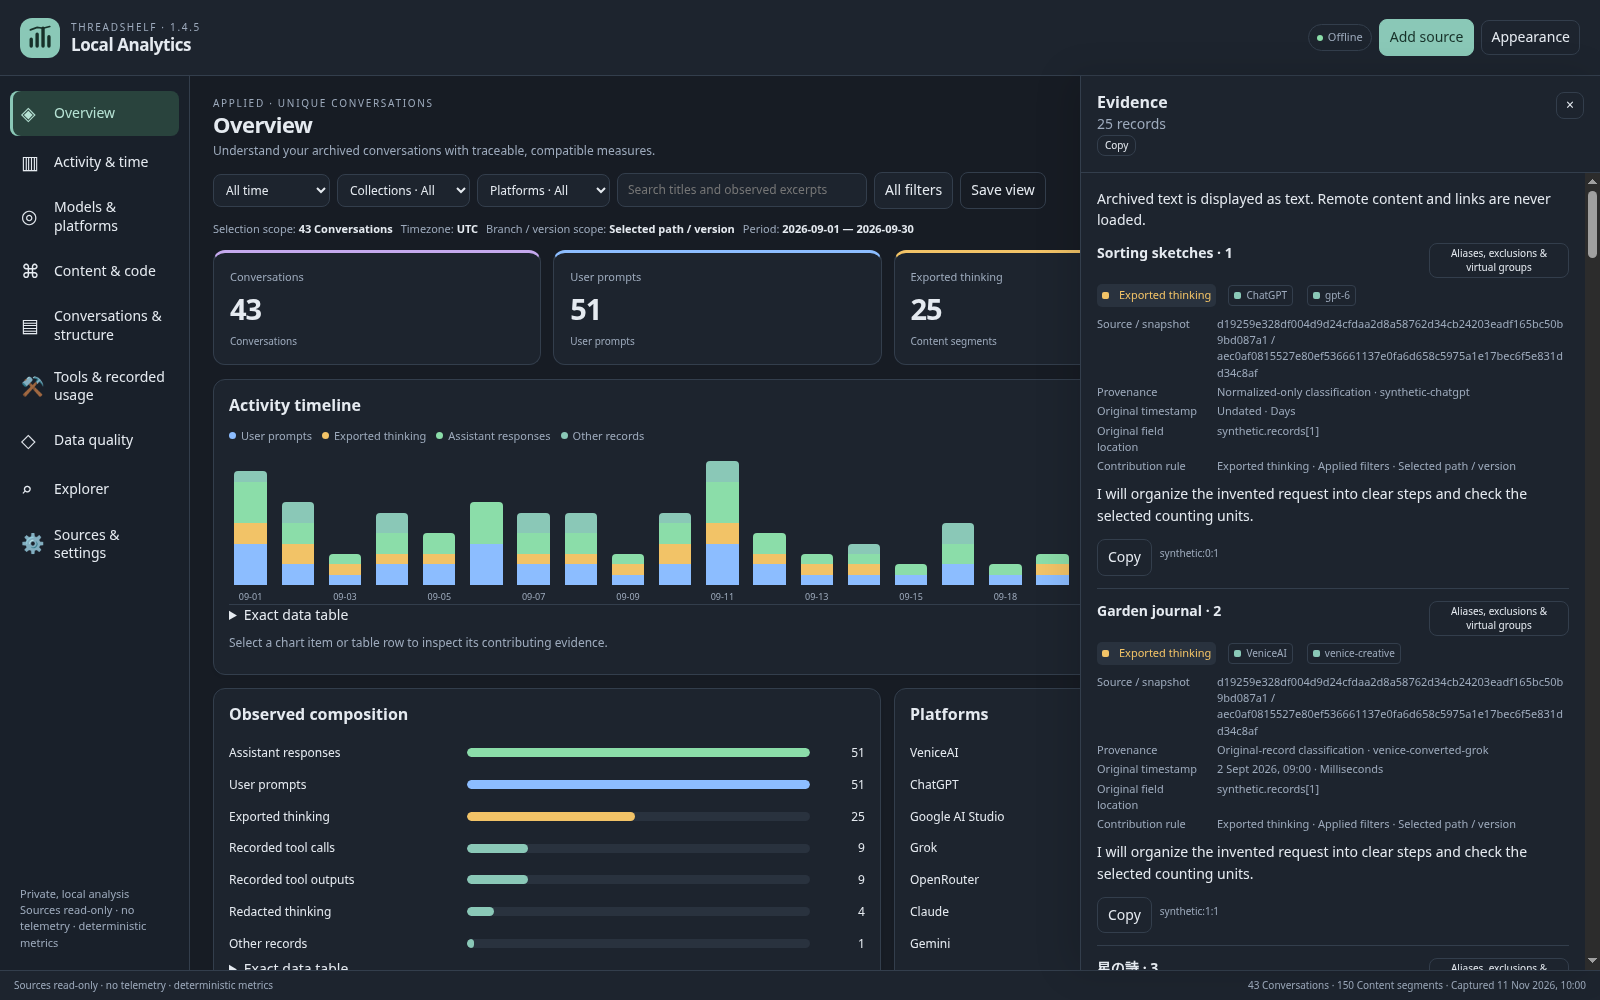
Evidence: return to records
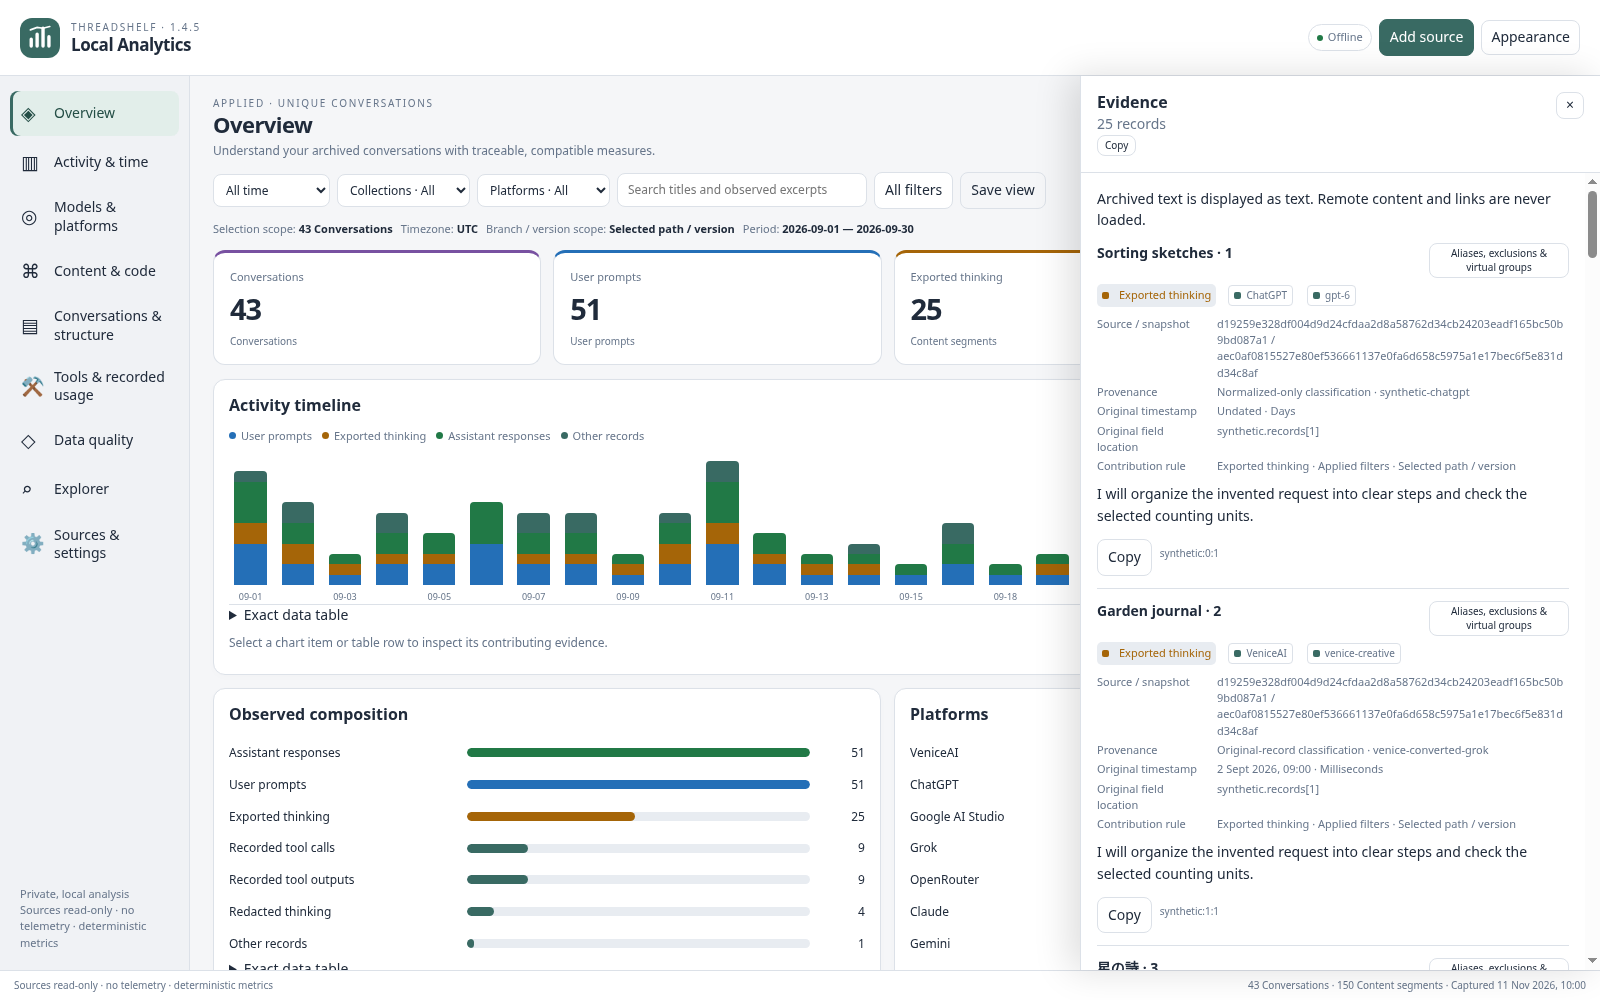
The evidence workspace retains the selected population and supports reviewing the contributors to a result. Full-body access depends on the source capture and content setting.
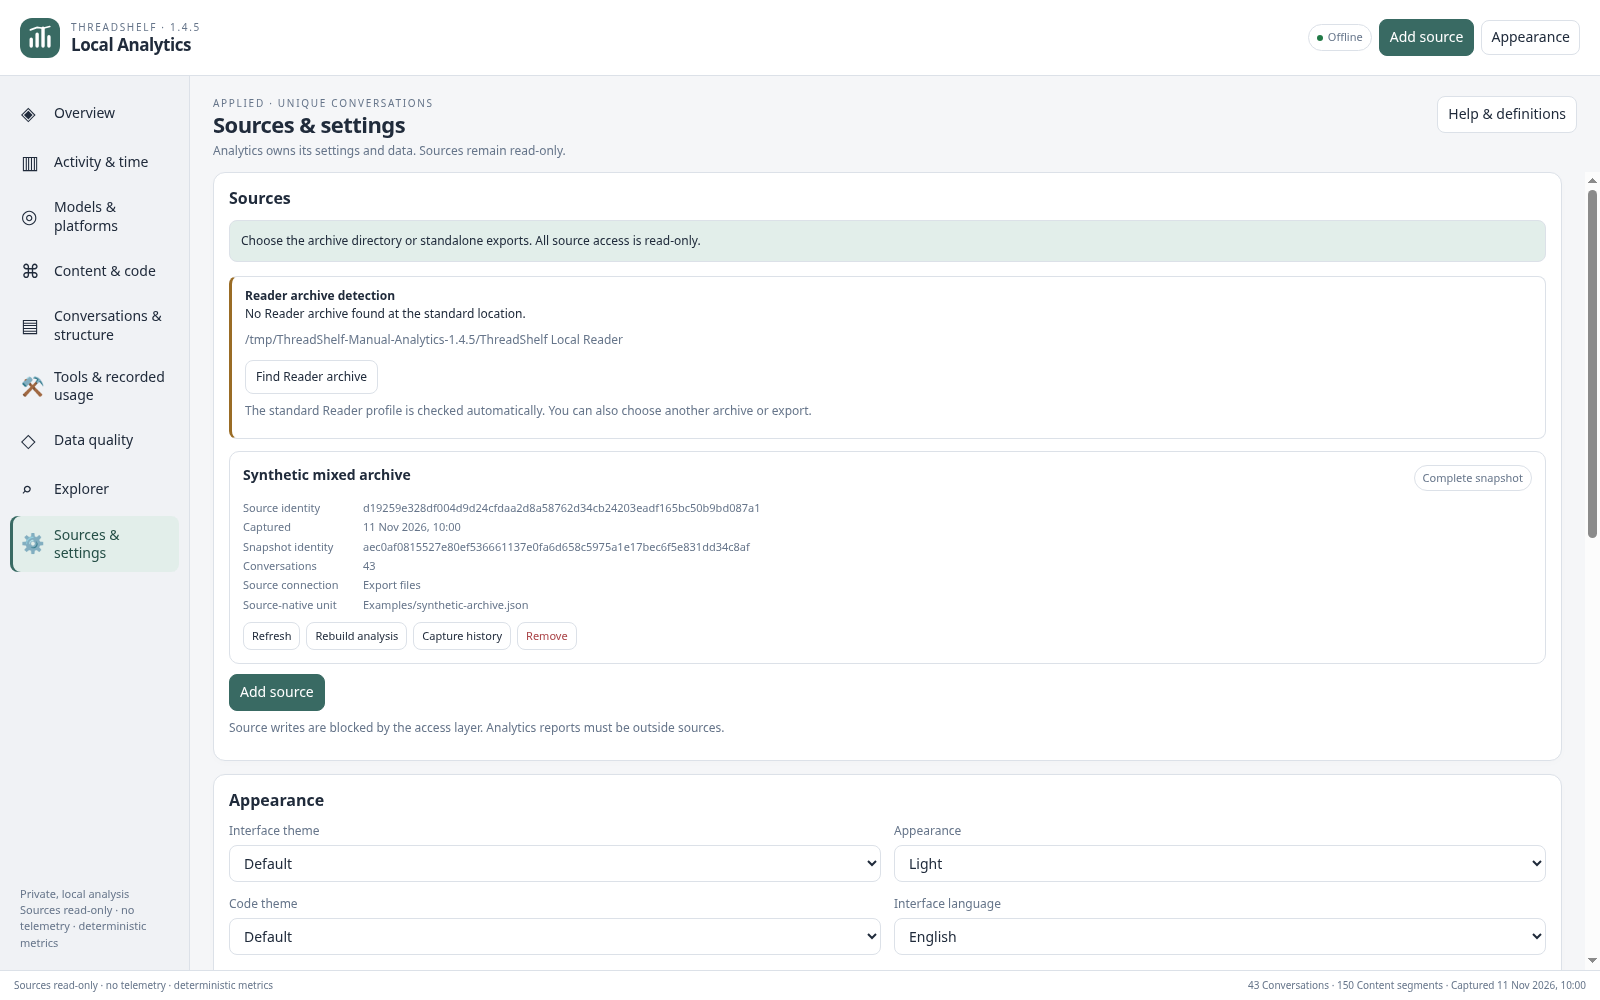
Settings and appearance
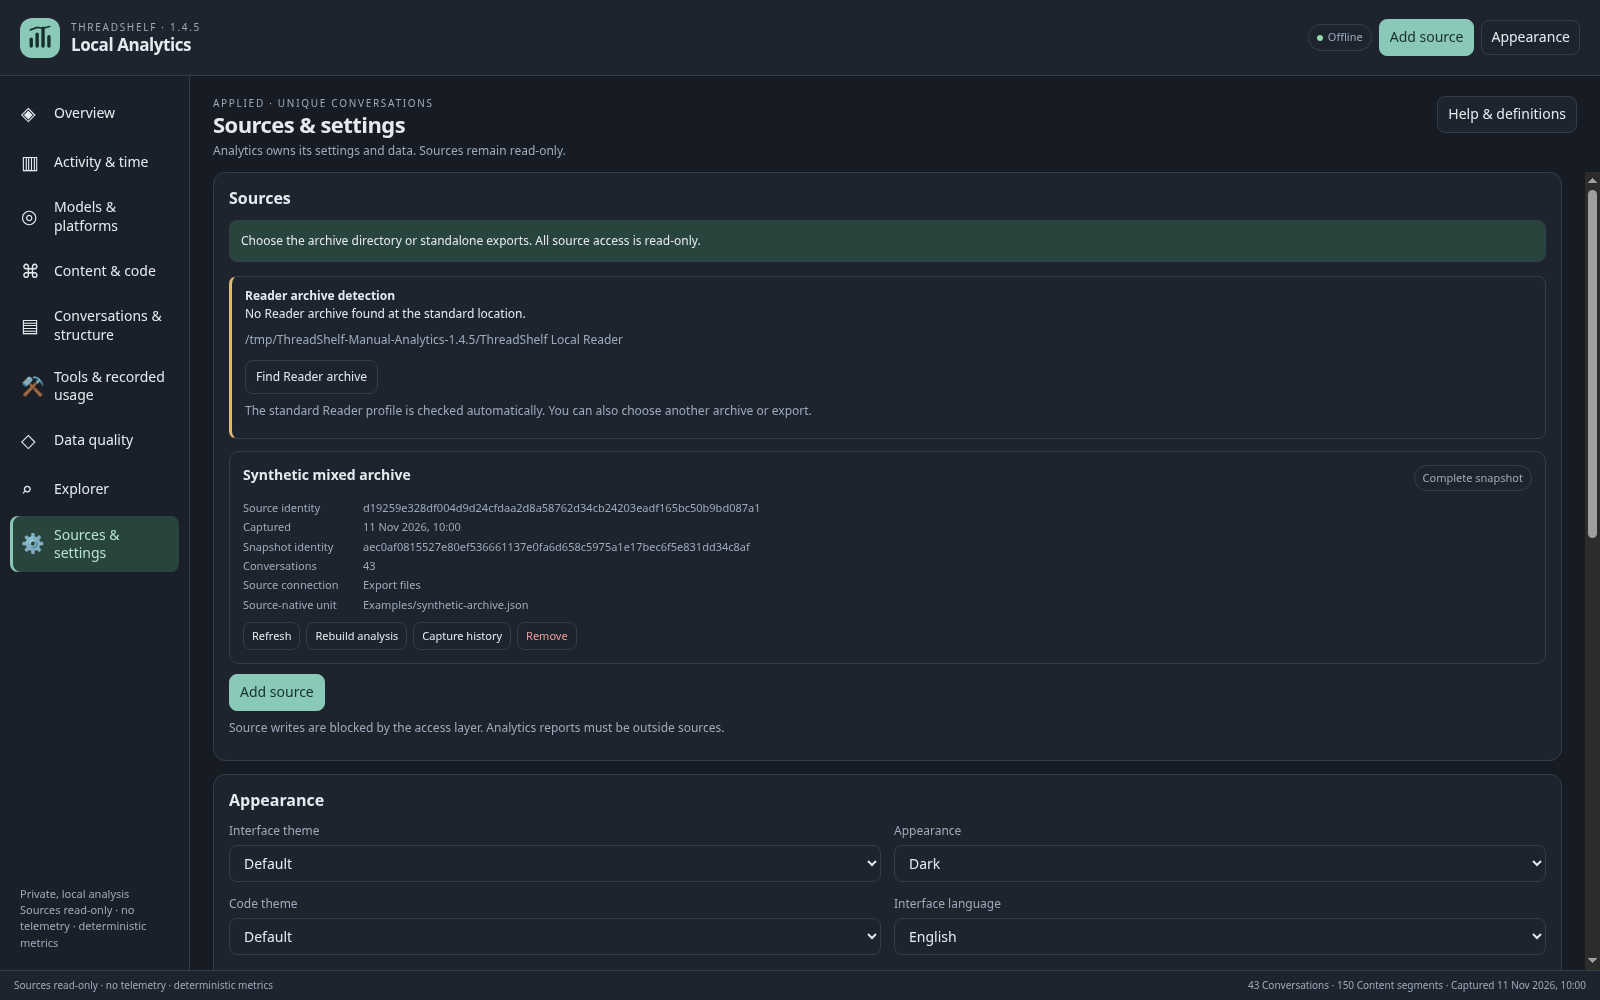
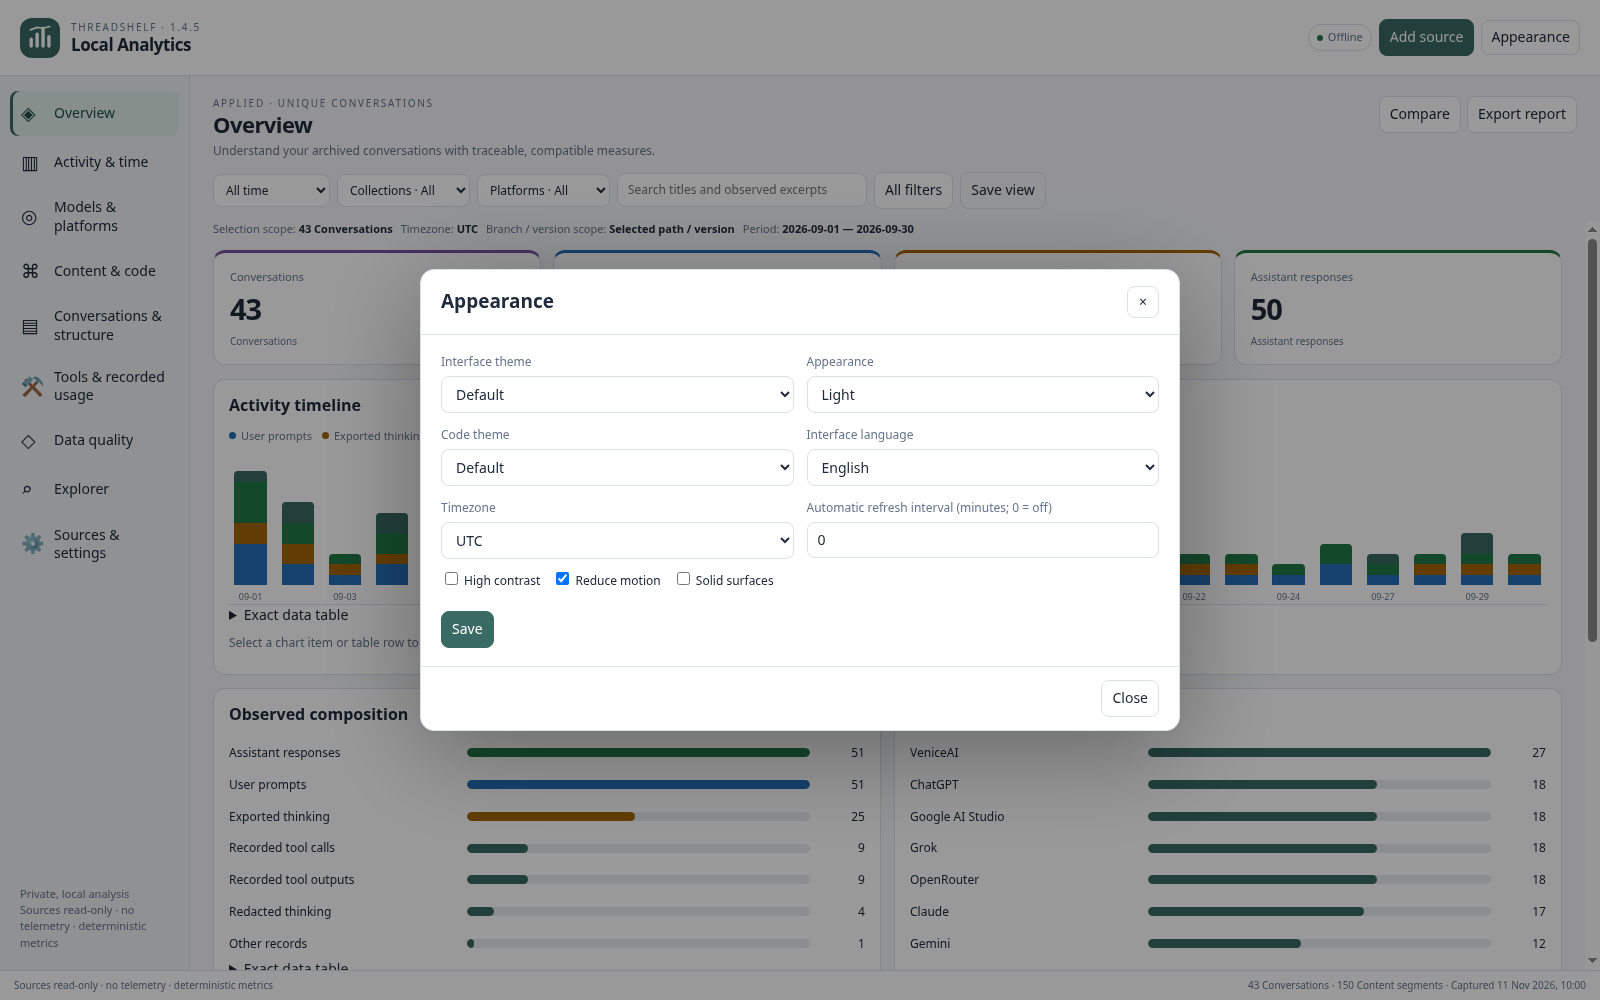
Settings control source access, content handling and presentation. Settings are not a substitute for selecting and applying an analysis scope. See the settings reference.
Compact density
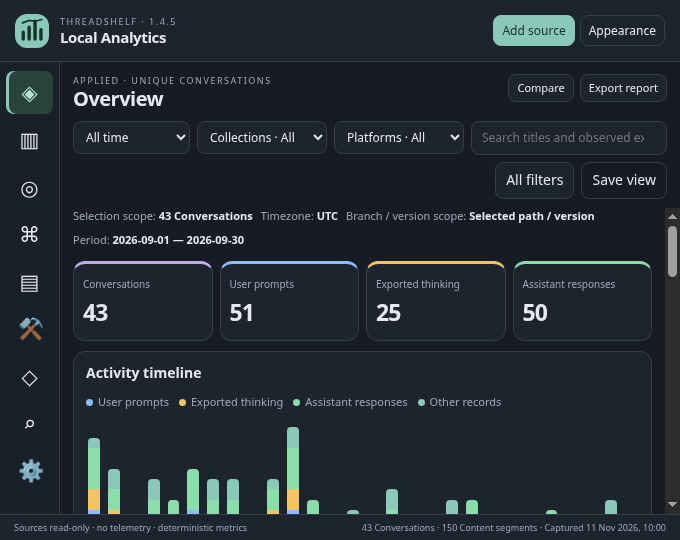
The compact layout keeps the real controls and counts available in less vertical space.